

Algo Trading
on Steroids
Backtest millions of CME ticks in seconds, then deploy the exact strategy you tested - powered by Roboquant's proprietary Test-to-Trade Engine.
CME futures, plus forex, gold and CFDs through your own MetaTrader 5 account.
Roboquant AI in action
Real code. Yours to read, edit and own.
Watch the AI write, compile, test, diagnose and optimize a strategy using the same tools as the platform.





New · MetaTrader 5
Your MetaTrader 5 account, now in Roboquant.
Connect an MT5 account at a supported broker or prop firm, demo or live. Chart your broker’s symbols, backtest and optimize on its own history, and run bots on the account, with the same AI and engine you use for CME futures. No VPS or Windows machine needed.

Open an account, then come back and connect it here.
- 1. Open a free demo at Moneta Markets.
- 2. Come back and enter the MT5 login Moneta Markets emails you.
- 3. Backtest on your own account’s data.
Prefer another broker? FP Trading · Ultima Markets
Pick your broker and server, then enter your MT5 login. The read-only investor password is enough for charts and backtests; add the trading password when you want bots. Connect 1 MT5 account on the Free plan, up to 10 on Ultra.
Your money stays at your broker. You deposit and withdraw with the broker. Roboquant never holds funds.
Private to you. Each account’s symbols, history and trades are visible only to you, and deleted when you disconnect.
Encrypted credentials. Passwords are stored encrypted and used only to connect your account.
Supported brokers and prop firms
- Moneta MarketsFeatured partner
- FP Trading
 Ultima Markets
 IQ Capital
No MT5 account yet? After you sign up, the connect screen links to a free demo at each broker, and to IQ Capital’s CFD challenges. Start with a free demo
Forex and CFDs are leveraged and can lose money quickly; backtests are simulations, not a promise of results. Features and limits vary by plan. MetaTrader is a trademark of MetaQuotes Ltd.; Roboquant is not affiliated with MetaQuotes.
A trading AI that writes strategies that compile.
Roboquant's AI writes your strategy, compiles it and fixes compile errors before you backtest — with the option to use your own model keys.
Choose any model. Roboquant AI is included — or turn any frontier model into a quant.


Add knowledge. The data store, docs and your research — one call away.
Your ORB v2 tested +31.8% yesterday.
I kept the walk-forward results and the Friday finding — want to add the score filter we discussed and re-run it?
Built-in memory. It remembers every backtest and finding across sessions.
Add tools. The whole platform is callable — backtests, optimizer, deploys.
Every fill simulated on real ticks.
Minute bars flatter a strategy — they fill you at prices that were never available. This one is filled tick by tick, over six years of ES, in the platform's own results card.
Based on closed-trade equity, matching the drawdown chart above. Recovery is measured from trough to previous peak; time underwater is peak to recovery. Durations are elapsed calendar time. Ongoing means not recovered by the end of the saved run.
- Periods
- 18
- Longest underwater
- 255d 12h
- Avg. recovery
- 36d 12h
- Ongoing at run end
- None
Deepest periods first. Average recovery includes recovered periods only.
| Peak | Trough | Recovered | Depth | Decline | Recovery | Underwater |
|---|---|---|---|---|---|---|
| −18.95% | 164d 6h | 91d 6h | 255d 12h | |||
| −13.55% | 91d 6h | 73d | 164d 6h | |||
| −9.87% | 36d 12h | 73d | 109d 12h | |||
| −7.72% | 36d 12h | 91d 6h | 127d 18h | |||
| −4.81% | 18d 6h | 36d 12h | 54d 18h |
- Peak
- Trough
- Recovered
- Time underwater
- 255d 12h
- Decline
- 164d 6h
- Recovery time
- 91d 6h
- Peak
- Trough
- Recovered
- Time underwater
- 164d 6h
- Decline
- 91d 6h
- Recovery time
- 73d
- Peak
- Trough
- Recovered
- Time underwater
- 109d 12h
- Decline
- 36d 12h
- Recovery time
- 73d
- Peak
- Trough
- Recovered
- Time underwater
- 127d 18h
- Decline
- 36d 12h
- Recovery time
- 91d 6h
- Peak
- Trough
- Recovered
- Time underwater
- 54d 18h
- Decline
- 18d 6h
- Recovery time
- 36d 12h
| Jan | Feb | Mar | Apr | May | Jun | Jul | Aug | Sep | Oct | Nov | Dec | Year total | |
|---|---|---|---|---|---|---|---|---|---|---|---|---|---|
| 2020 | - | - | - | - | +0.0 | +0.0 | +4.1 | +6.2 | +0.0 | +8.2 | -3.4 | +0.0 | +40.3 |
| 2021 | -6.3 | +0.0 | +1.1 | +9.5 | +10.1 | +0.0 | +11.4 | +2.1 | +0.0 | -4.8 | +5.7 | +0.0 | +99.1 |
| 2022 | +4.0 | +0.0 | -3.1 | +1.2 | -2.2 | +0.0 | -1.1 | +6.7 | +0.0 | +12.6 | +0.8 | +0.0 | +33.2 |
| 2023 | +1.7 | +0.0 | +9.7 | -0.5 | +6.4 | +0.0 | +7.1 | -3.2 | +0.0 | -4.2 | +9.5 | +0.0 | +64.4 |
| 2024 | +8.4 | +7.6 | +0.0 | +10.4 | -1.5 | +0.0 | +0.8 | +8.0 | +0.0 | +3.1 | -4.4 | +0.0 | +85.8 |
| 2025 | +3.9 | +6.5 | +0.0 | +2.1 | +14.1 | +0.0 | +7.3 | -2.5 | +0.0 | +4.8 | +3.4 | +0.0 | +134.1 |
| 2026 | +2.2 | +5.6 | +0.0 | +7.3 | +0.0 | - | - | - | - | - | - | - | +22.3 |
Closed-trade P&L after commission, grouped by exit time in ET. Weeks start Monday. Only periods with closed trades are shown.
Total net P&L +$315,545.00
| Period | Net P&L | Trades | Win rate | Avg / trade |
|---|---|---|---|---|
| 2026 8 trades · 75.0% wins Avg / trade +$7,421.13 | +$59,369.00 | 8 | 75.0% | +$7,421.13 |
| 2025 20 trades · 85.0% wins Avg / trade +$7,624.45 | +$152,489.00 | 20 | 85.0% | +$7,624.45 |
| 2024 20 trades · 75.0% wins Avg / trade +$2,625.30 | +$52,506.00 | 20 | 75.0% | +$2,625.30 |
| 2023 20 trades · 60.0% wins Avg / trade +$1,198.20 | +$23,964.00 | 20 | 60.0% | +$1,198.20 |
| 2022 20 trades · 65.0% wins Avg / trade +$463.70 | +$9,274.00 | 20 | 65.0% | +$463.70 |
| 2021 20 trades · 80.0% wins Avg / trade +$695.50 | +$13,910.00 | 20 | 80.0% | +$695.50 |
| 2020 11 trades · 81.8% wins Avg / trade +$366.64 | +$4,033.00 | 11 | 81.8% | +$366.64 |
Newest periods first. First and last periods may cover only part of the calendar period.
One engine from backtest to live trading.
Backtesting, optimization and live trading run on the same compiled Rust engine — so brackets and trailing stops behave consistently from test to execution.
Compiled, not interpreted. Six years of tick-by-tick ES resolves in seconds; an optimizer trial averages a quarter second.
Tick, depth and order-book fills. Bar-level for speed, tick-level for truth, L2 book-walk when size matters.
One engine, tester to live. Same engine, different feed — brackets and trailing stops behave identically in both.
200 tick-level trials. 54.7 seconds.
Sweeping parameters is how strategies get overfitted — so every trial is scored on data it never saw. Six parameters over 3.5 years of ticks, in the platform's own optimizer view.
Charts that show what your bot is thinking.
A full futures charting terminal on real-time CME data — and the only one where your strategy draws its own analysis on the chart.
Strategy drawings on the chart. Your bot’s zones, levels, entries and exits render live — you see the setup it saw.
Order-flow: footprint and depth. Footprint bars, volume profile and L2 book visuals on real CME feeds.
Custom indicators in Python. Write any indicator with tunable parameters; it renders like a native one.
It finds what the equity curve hides.
On one of our research runs the curve looked fine — until the analytics split it by weekday. The edge died on Fridays, and a one-line session filter fixed it.
Thursdays made +$8,750 across 28 trades. Fridays lost -$8,850 across 25. One line — skip Fridays — and the strategy that looked mediocre was worth keeping. This is the kind of thing you find here, or you find it with real money.
Risk, quantified. VaR $300 per trade at 95%, Kelly-optimal size 1.8% — computed on every run.
Time-of-day and seasonality. P&L by hour, weekday and month — schedule effects show up before you trade them.
MAE / MFE trade efficiency. How far trades ran against you before working — the raw material for better stops.
Every bot keeps one unbroken track record.
One click deploys the file you just validated into an isolated container on your connected broker account, such as Tradovate. Edit its parameters while it runs, come back in six months — its equity history keeps going. The longer it runs, the more you actually know.
Risk caps enforced server-side. Loss limits and kill switches hold even if your strategy, browser or connection doesn’t.
A private, sandboxed container per bot. Kernel-level isolation, no shared runtime, running 24/7.
Live P&L from the broker. What you see is what the account says — not what the bot believes.
TradingView alerts, executed on Tradovate.
Roboquant Connect is a separate product: point your TradingView alerts at a Connect webhook and it places the orders on your Tradovate accounts — including prop-firm accounts issued on Tradovate — with risk controls in the middle. Check your firm's rules on automation and third-party hosting before you connect it.
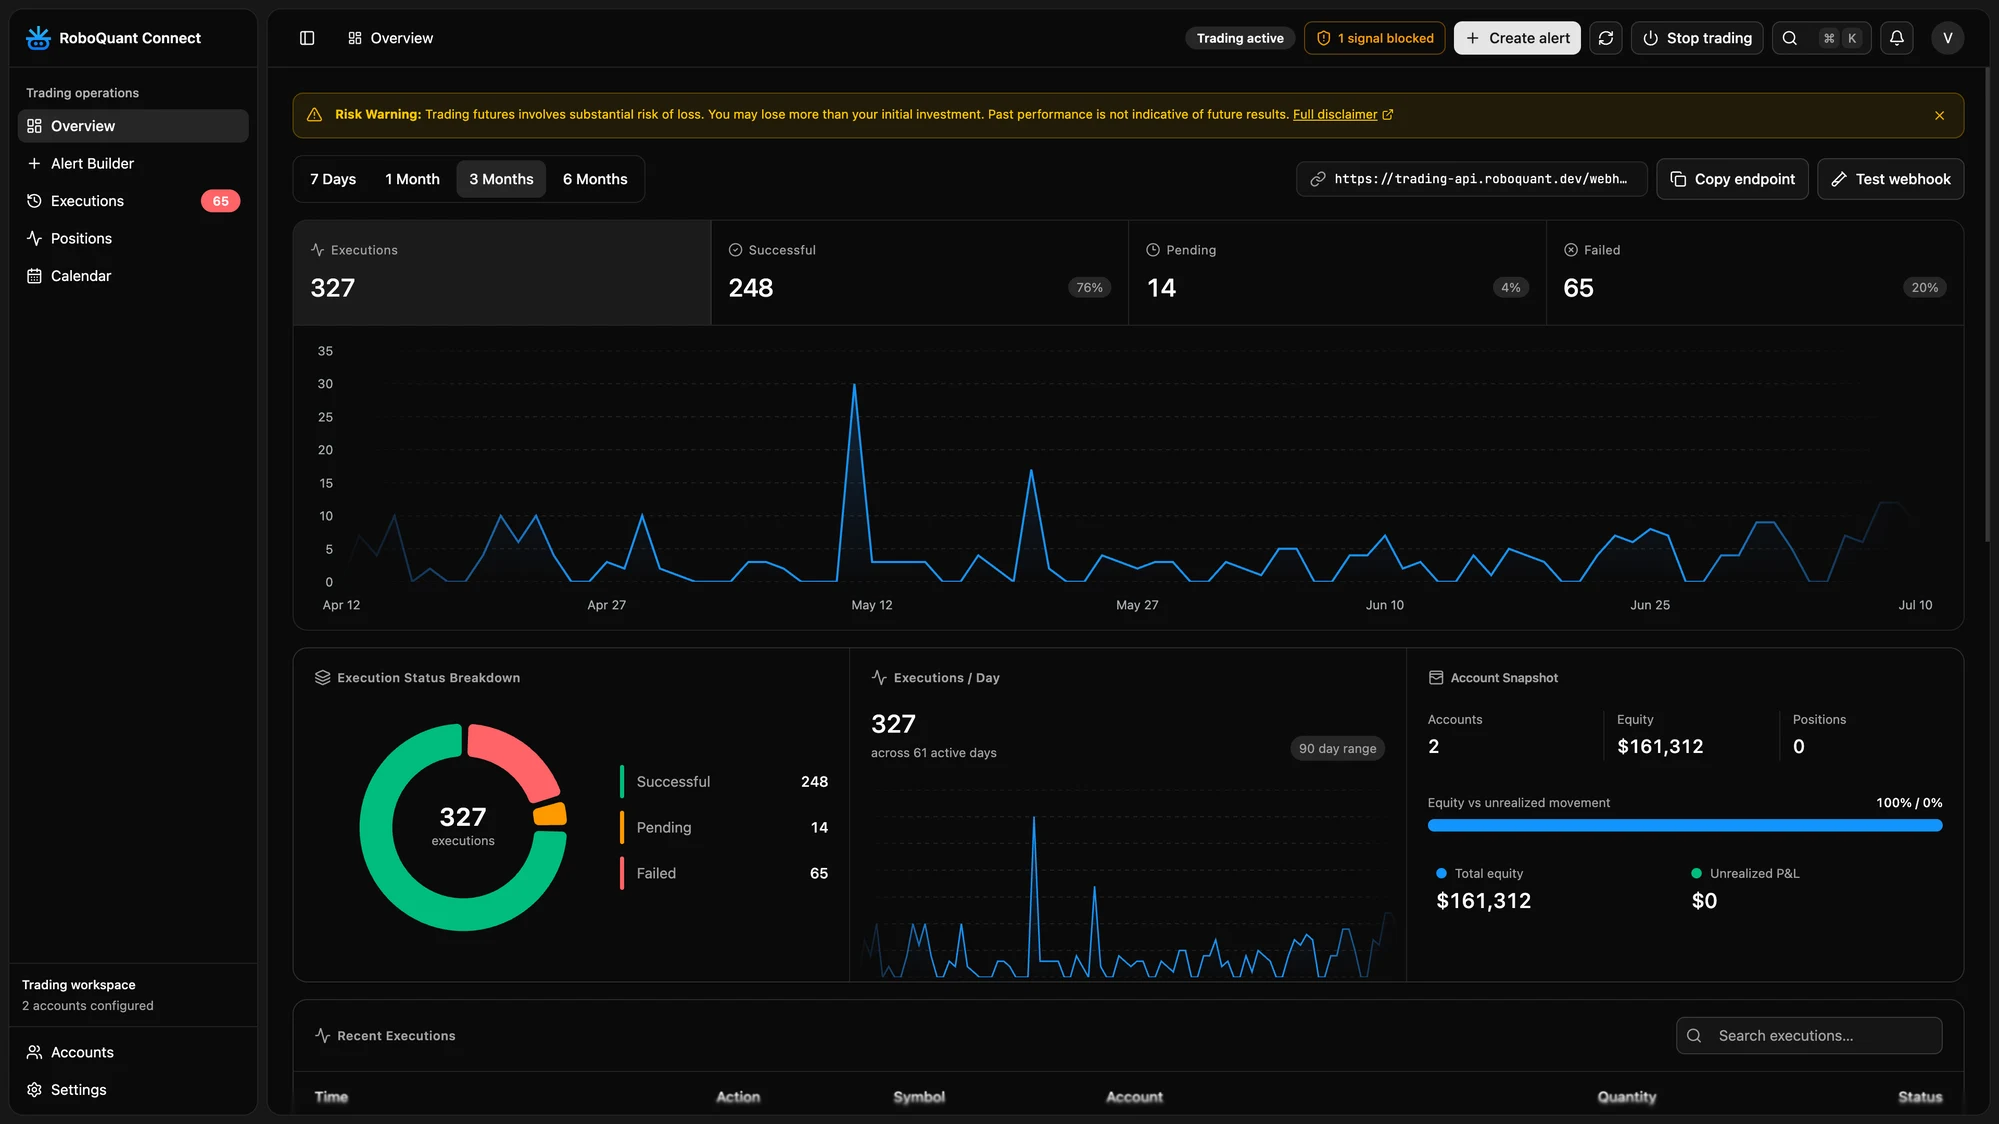
Multiple accounts. One alert can place orders on every Tradovate account you connect.
Daily limits. Per-account daily trade and daily-loss limits block new entries once hit.
Kill switch and allowed symbols. Stop every order at once, and only trade the symbols you allow.
Run Roboquant from ChatGPT, Claude or Cursor.
Connect the Roboquant MCP server once, and the AI you already talk to can build, backtest and monitor your strategies.
ChatGPT can make mistakes. Check important info.
Works where you work. Claude, ChatGPT, Claude Code, Cursor — one OAuth connect, no keys to paste.
The full platform, as tools. Strategies, backtests, optimizer, deployments — callable by your AI.
Chart vision. The AI can look at your backtest charts, not just the numbers.
More honest backtests start with better data.
A backtest is only as honest as the data under it. Licensed CME market data—not delayed quotes or minute bars from a charting API. Access up to sixteen years of OHLCV and tick history, with order-book depth on higher tiers, stored next to the engine so backtests read it in seconds.
OHLCV candles, one row per minute — the classic view.
Every trade event, tick by tick — time, price, size, side.
Ten price levels of resting liquidity, on every change.
The full book: every individual order at every price level.
Most platforms stop at the first row. Your edge usually lives in the other three.
Counts from the store: 9.4M ES trades in July 2026 (~430k per session); 3.0 GB of raw MBP-10 book updates on Aug 3 alone. Multipliers are relative to one day of 1-minute bars.
Tick and bar history from July 2010. Full order-book history lands daily and keeps accumulating.
Indices to crypto, full-size and micros — every one with tick-level history.
Simple pricing. Start free.
Roboquant 2.0 is live. Everyone can start free. Pick monthly or annual billing inside the app.
AI credits cover strategy generation, compilation and tool calls. BYOK is available on Pro and above; requests billed to your provider do not consume Roboquant credits.
Free plan
Create a strategy and run your first evidence-backed test.
Start freeRoboquant 2.0 is live. Everyone can start free.
See all plan features
- Guided AI strategy builder
- All Roboquant strategy templates
- One year of OHLCV history
- 5 standard backtests per day
- 1 small optimization per day (one parameter, grid)
- Basic performance metrics
- Historical/T+1 RoboCharts
- Interactive Replay preview
- Community support
- MetaTrader 5: 1 connected account
Billed monthly
For turning an idea into a strategy you can validate seriously.
Get StarterRoboquant 2.0 is live. Everyone can start free.
See all plan features
- Full strategy and indicator template catalog
- Full AI strategy builder and compile-fix loop
- OHLCV backtests with tick-level fills
- Three years of OHLCV and tick history
- Unlimited standard backtests under fair use
- 1 small optimization per day (one parameter, grid)
- Monte Carlo and trade-distribution analysis
- Delayed CME charts and history
- 1 connected Tradovate account (Demo only)
- MetaTrader 5: 2 connected accounts
Billed monthly
For validating and running your first strategy live.
Get ProRoboquant 2.0 is live. Everyone can start free.
See all plan features
- Everything in Starter
- Eight years of OHLCV and tick history
- 2 connected Tradovate accounts (Demo or Live)
- 1 native deployment slot (Demo and Live combined)
- IS/OOS and multi-symbol OHLCV validation
- Grid optimizer with up to 500 trials
- Bring your own AI provider key (BYOK)
- Live monitoring, risk caps and kill switches
- MetaTrader 5: 3 connected accounts
Billed monthly
For systematic traders running multiple strategies or accounts.
Get EliteRoboquant 2.0 is live. Everyone can start free.

See all plan features
- Everything in Pro
- Up to sixteen years of OHLCV and tick history
- Recent L2 / MBP-10 history and book fills
- 5 connected Tradovate accounts (Demo or Live)
- 3 native deployment slots (Demo and Live combined)
- Bayesian, genetic, Pareto and walk-forward validation
- Up to 5,000 trials with sixteen parallel workers
- External MCP access and priority support
- MetaTrader 5: 5 connected accounts
Billed monthly
For portfolio-scale execution, order flow and compute priority.
Get UltraRoboquant 2.0 is live. Everyone can start free.
See all plan features
- Everything in Elite
- Maximum available CME history
- Recent L2, MBO and L3 order-flow windows
- 20 connected Tradovate accounts (Demo or Live)
- 7 native deployment slots (Demo and Live combined)
- All optimizer modes plus Turbo
- Up to 25,000 trials with thirty-two workers
- Priority MCP, early templates and scheduled onboarding
- MetaTrader 5: 10 connected accounts
CME real-time display requires an eligible subscriber classification; professional data packages are quoted separately.
Questions, answered.
Stop wondering whether it works.
Describe the strategy you've been meaning to test. See it built, filled tick by tick and validated out of sample before you risk a cent.
Start free